Dataset releases
The 1.2 release is now live on the syngoportal.org website. Performing geneset analyses or browsing data makes use of the latest dataset version. The complete dataset ("bulk download") for any release can be found at the bottom of the frontpage
SynGO release 1.2 aka "20231201"
A major update to the SynGO knowledgebase with 30% more genes and annotations. In total, this release contains 4218 annotations against 1602 unique human genes.
SynGO release 1.1 aka "20210225"
The first major update to the SynGO knowledgebase featured 356 new annotations, 123 new genes and many updated annotations. In total, this release contained 3242 annotations against 1233 unique human genes. You can use this website for browsing data and re-analyzing your datasets against the SynGO 1.1 release (eg. to reproduce past results) by visiting this URL:
SynGO website with release 1.1 dataSynGO release 1.0 aka "20180731"
This is the dataset released with the original SynGO manuscript. It featured 2918 annotations against 1112 unique human genes. You can use this website for browsing data and re-analyzing your datasets against the SynGO 1.0 release (eg. to reproduce past results) by visiting this URL:
SynGO website with release 1.0 datainput data
The SynGO geneset tool requires your list of gene IDs to either be human hgnc/ensembl/entrez/symbols. Species other than human are currently not supported, you should use external tools (eg; biomart) to retreive human orthologs for your gene list for now. You can use our
ID conversion tool to map your protein/gene IDs into an ID type supported by SynGO.
background set
The geneset analysis tool intersects your gene list with SynGO annotated genes and compares this to some background set using a Fisher exact test,
as detailed here. So picking an appropriate background set is important. We provide a list of all brain expressed genes as a default background set, defined as 'expressed in any GTEx v7 brain tissue'. We encourage the use of custom background lists that are appropriate for your experiment (eg; if you perform an IP against some synaptic gene, you should not be using whole brain as the background set). Don't forget to mention what background set was used when reporting your results.
enrichment analysis
Fisher exact test
For each ontology term, we apply a 1-sided Fisher exact test with 'greater than' hypothesis. The contingency table is built as follows:
| your gene list x | background b |
|---|
| in term t | m11 = overlap between x and genes annotated to t | m21 = overlap between b and genes annotated to t |
|---|
| not in term t | m12 = total size of x (including genes not mapped to SynGO DB) - m11 | m22 = total size of b (including genes not mapped to SynGO DB) - m21 |
|---|
finding enriched terms
To find enriched terms within the entire SynGO ontology, we first select the most specific term where each 'gene cluster' (unique set of genes) is found and then apply multiple testing correction using False Discovery Rate (FDR) on the subset of terms that contain these 'gene clusters'. The result is found in the "q-value" column of the output tables on the website and Excel files availble through 'Download analysis' (NaN entries indicate the term either holds too few genes or was not a 'gene cluster')
SynGO annotation systematics
Evidence tracking
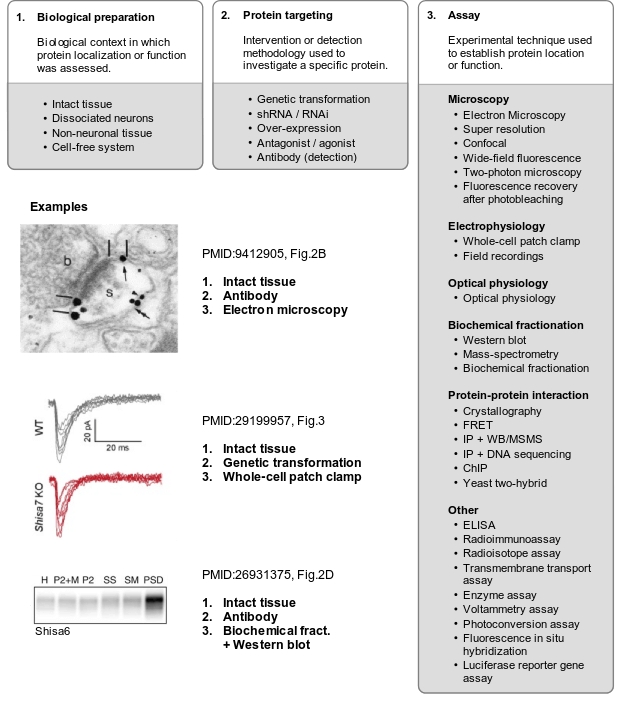
To systematically track evidence, classifications were designed for the model systems used. For synaptic localization (CC), microscopy and biochemical studies were defined as the main experimental classes, each with several sub-classes. For functional studies, experimental classes were defined based on perturbation type and the methodology (assay) used to detect the consequences, again with several sub-classes. These classifications were made coherent with the Evidence and Conclusions Ontology (ECO) (Giglio et al., 2018), and new ECO terms were defined. Together, these three dimensions of evidence, (i) model system/preparation, (ii) experimental perturbation and (iii) assay, provide a systematic, coherent and detailed definition of the evidence to annotate synaptic genes.
Detailed reference to these three dimensions of evidence was stored as part of each annotation (PubMed ID, figure numbers, panels), providing a detailed rationale for each annotation, which can be reviewed by SynGO users.
Types of membrane association
We follow GO-principles in distinguishing different types of membrane association using the following terminology
- intrinsic component of membrane
proteins that have some covalently attached moiety embedded in the membrane- integral component of membrane
proteins in which some part of the peptide sequence spans all or part of the membrane. A subclass of this covers transmembrane proteins; those that completely span the membrane - anchored component of membrane
Proteins tethered to a membrane by a covalently attached anchor, such as a lipid moiety, which is embedded in the membrane
- extrinsic component of membrane
proteins that are associated with membranes, but are neither directly embedded in the membrane nor anchored by covalent bonds to any moiety embedded in the membrane. Proteins that associate indirectly via protein-protein interactions are not annotated as membrane-associated protein by SynGO (see examples below)
To illustrate the use of membrane terminology we provide examples of several known membrane-associated proteins:
| name | feature | annotation |
|---|
| GluR1 | has transmembrane domain | integral component of postsynaptic specialization membrane |
| PSD-95 | has functional palmitoylation site | anchored to postsynaptic specialization membrane |
| PKCα | has lipid-binding C2 domain | extrinsic component of postsynaptic membrane |
Submit your data
The SynGO database is ever growing and thriving on community participation. We welcome suggestions for synaptic location/function annotations that are currently missing, head over to the
submit page to contribute to this project.
Technical support
supported browsers
This website works best with Chrome or Firefox. Javascript must be enabled. We've also tested Safari, Microsoft Edge and various Chromium-based browsers. Internet Explorer is not incompatible.
working with SVG files
The SynGO tools export graphics as SVG files (a vector graphics format) so you can incorporate these as high quality figures into your presentations and publications. You can use your browser as a viewer by simply drag&drop'ing the downloaded SVG onto your browser. SVGs can be edited using e.g. Adobe Illustrator or LibreOffice Draw.
Privacy Policy
ID mapping tool
For user convenience we built an ID mapping tool to converts protein/gene IDs to a format compatible with our database. The external webservice
MyGene.info performs the actual conversion of your input data. Your data is directly sent to this webservice from your browser, your data does not pass through the SynGO webserver at any point. Privacy terms of the external website apply for this tool, see further
MyGene.info terms of use.
The SynGO geneset analysis tool does not store your data
SynGO data is downloaded and cached in your computer's local storage for efficiency upon first loading this website. This enables the geneset analysis to be performed locally within your browser using the pre-downloaded SynGO data and javascript code. So your input data for geneset analysis does not leave your computer, is not stored anywhere else and remains private at all times.